
01
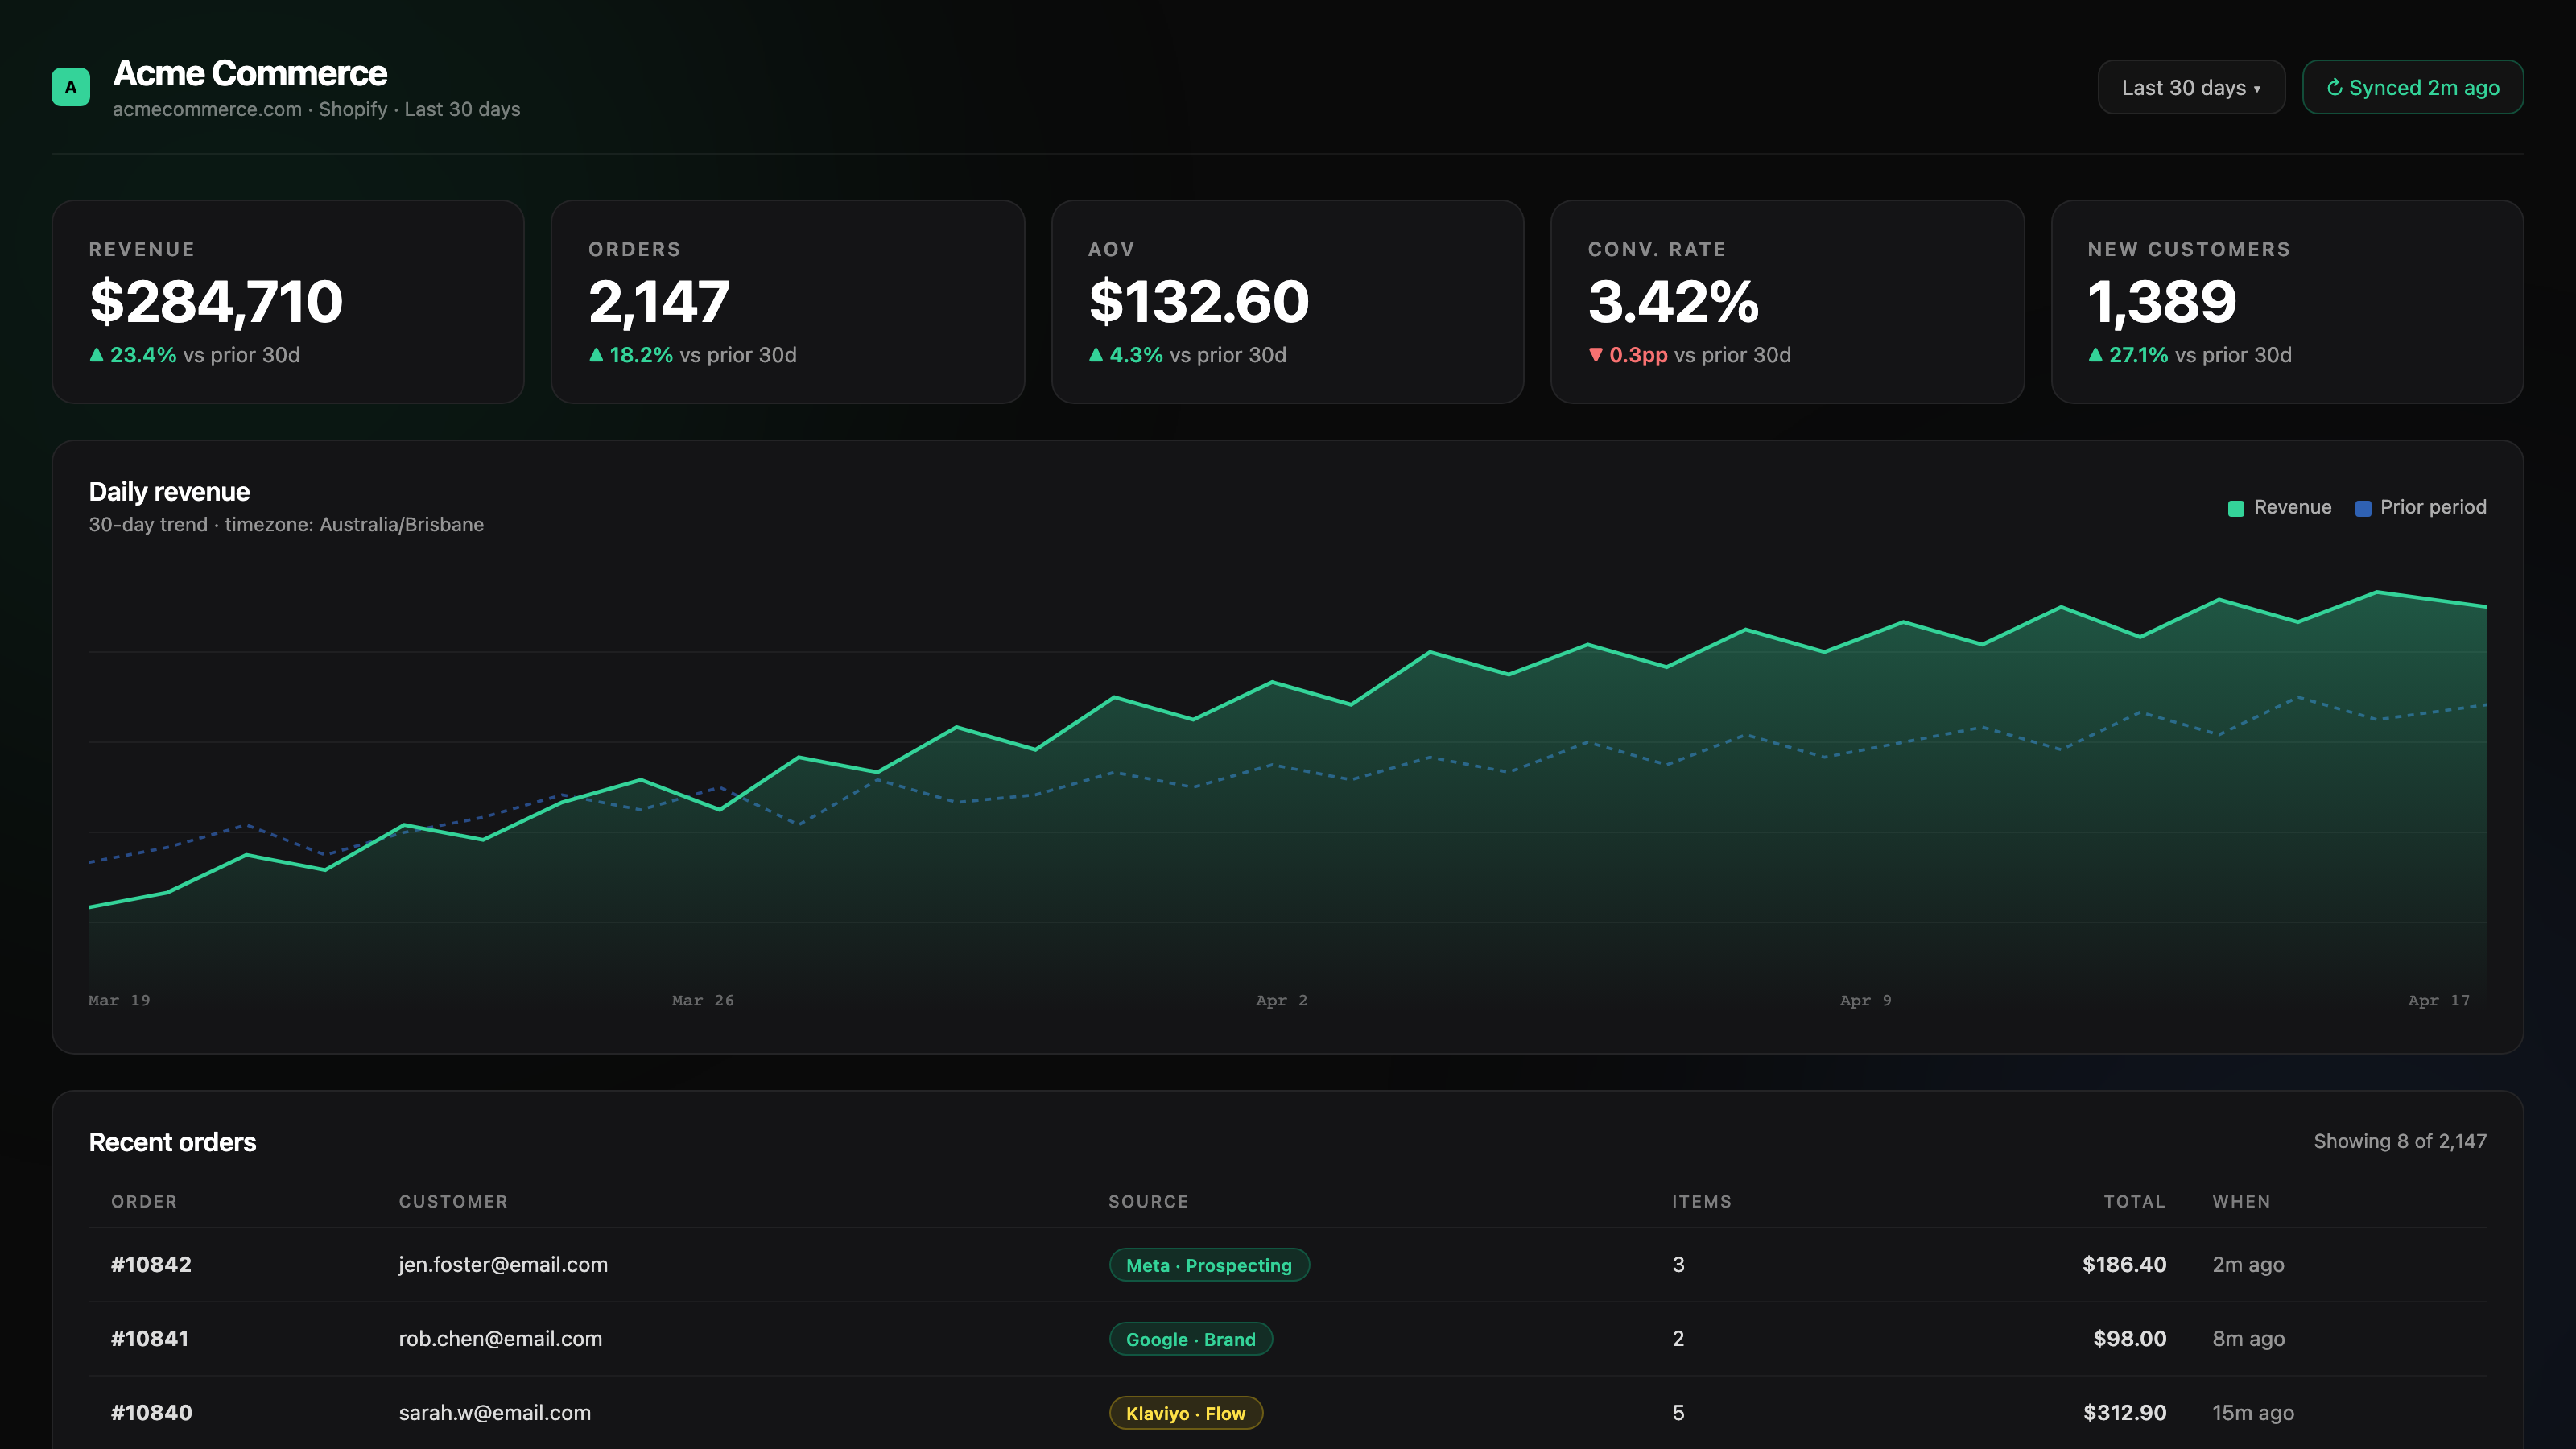
Revenue & orders — all in one view
Shopify orders, revenue, AOV, and customer count — daily, weekly, monthly. Timezone-correct. Drill down to a single order or customer. Compare any two periods. See what actually moved the needle.
The Cultivator Dashboard
See your revenue, ads, email, and UX in real time. Plug in your own AI agent.
Always free.
*limited time trial for all users, always free for current Cultivator clients
Built by the team at The Cultivator · $20M+ in client revenue
01
Shopify orders, revenue, AOV, and customer count — daily, weekly, monthly. Timezone-correct. Drill down to a single order or customer. Compare any two periods. See what actually moved the needle.
02
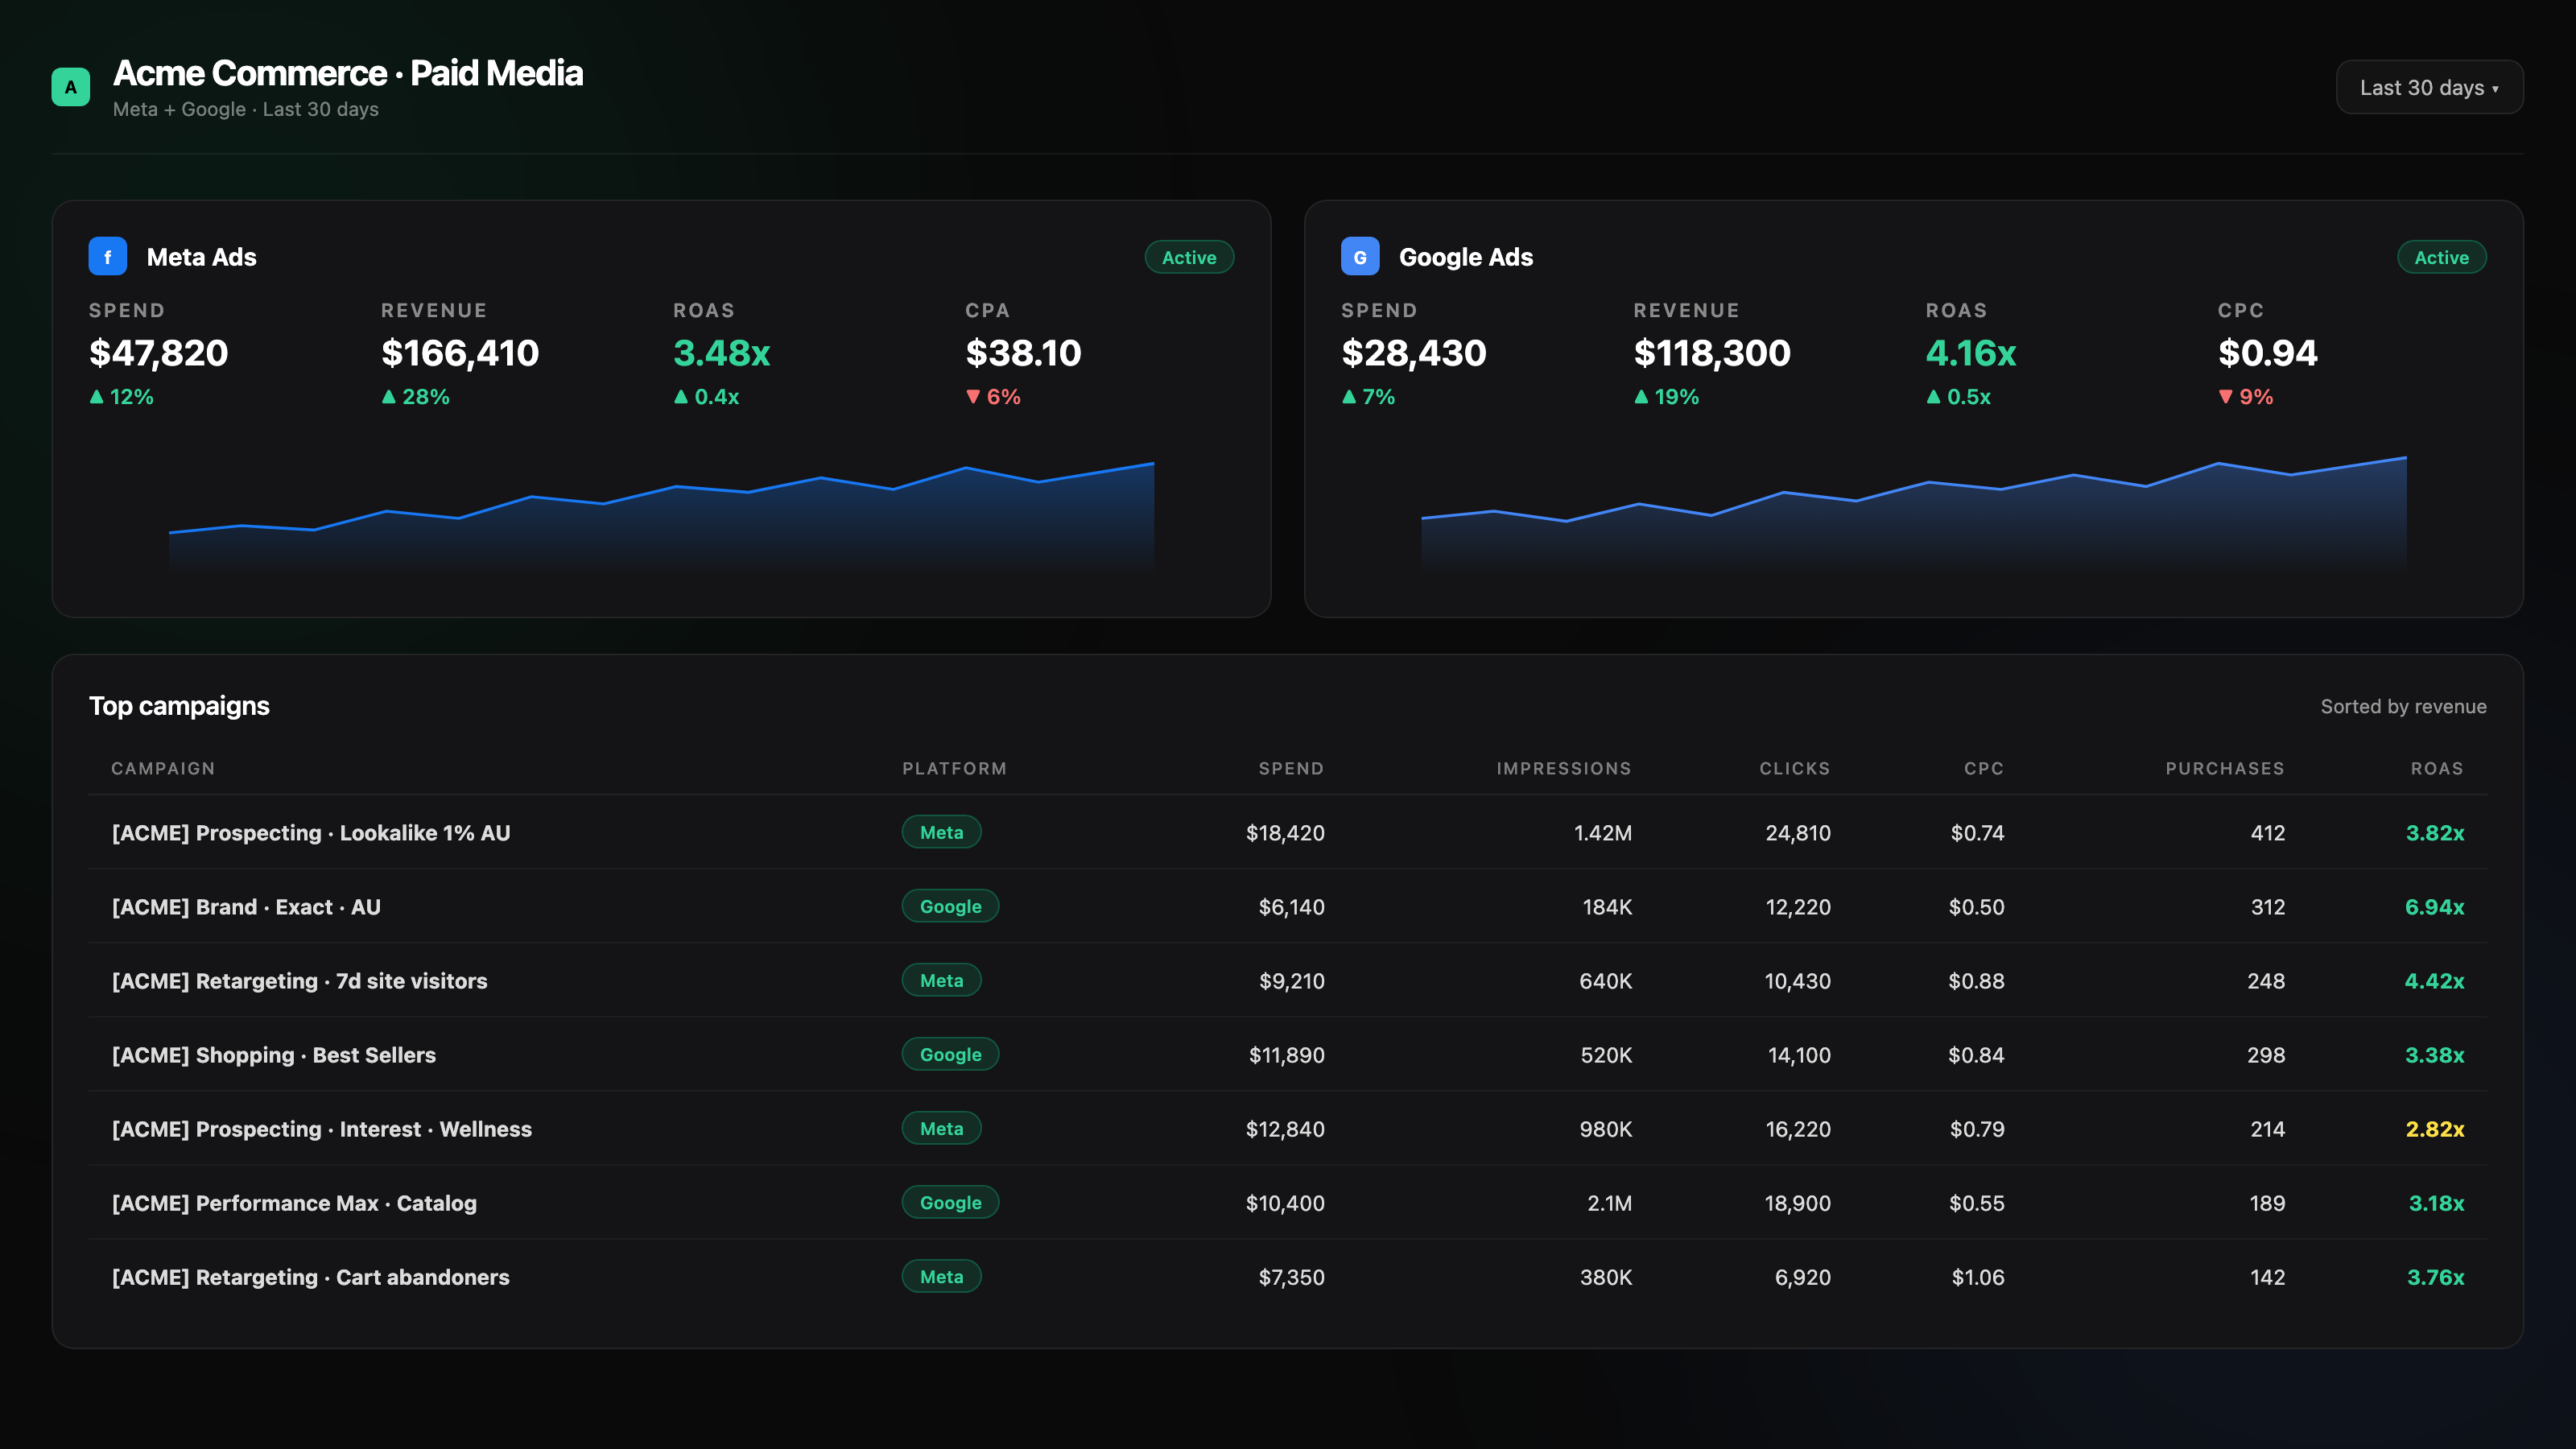
Meta, Google, and TikTok campaigns side by side. Spend, impressions, clicks, ROAS — by campaign, by platform, by time period. No more flipping between ad managers.
03
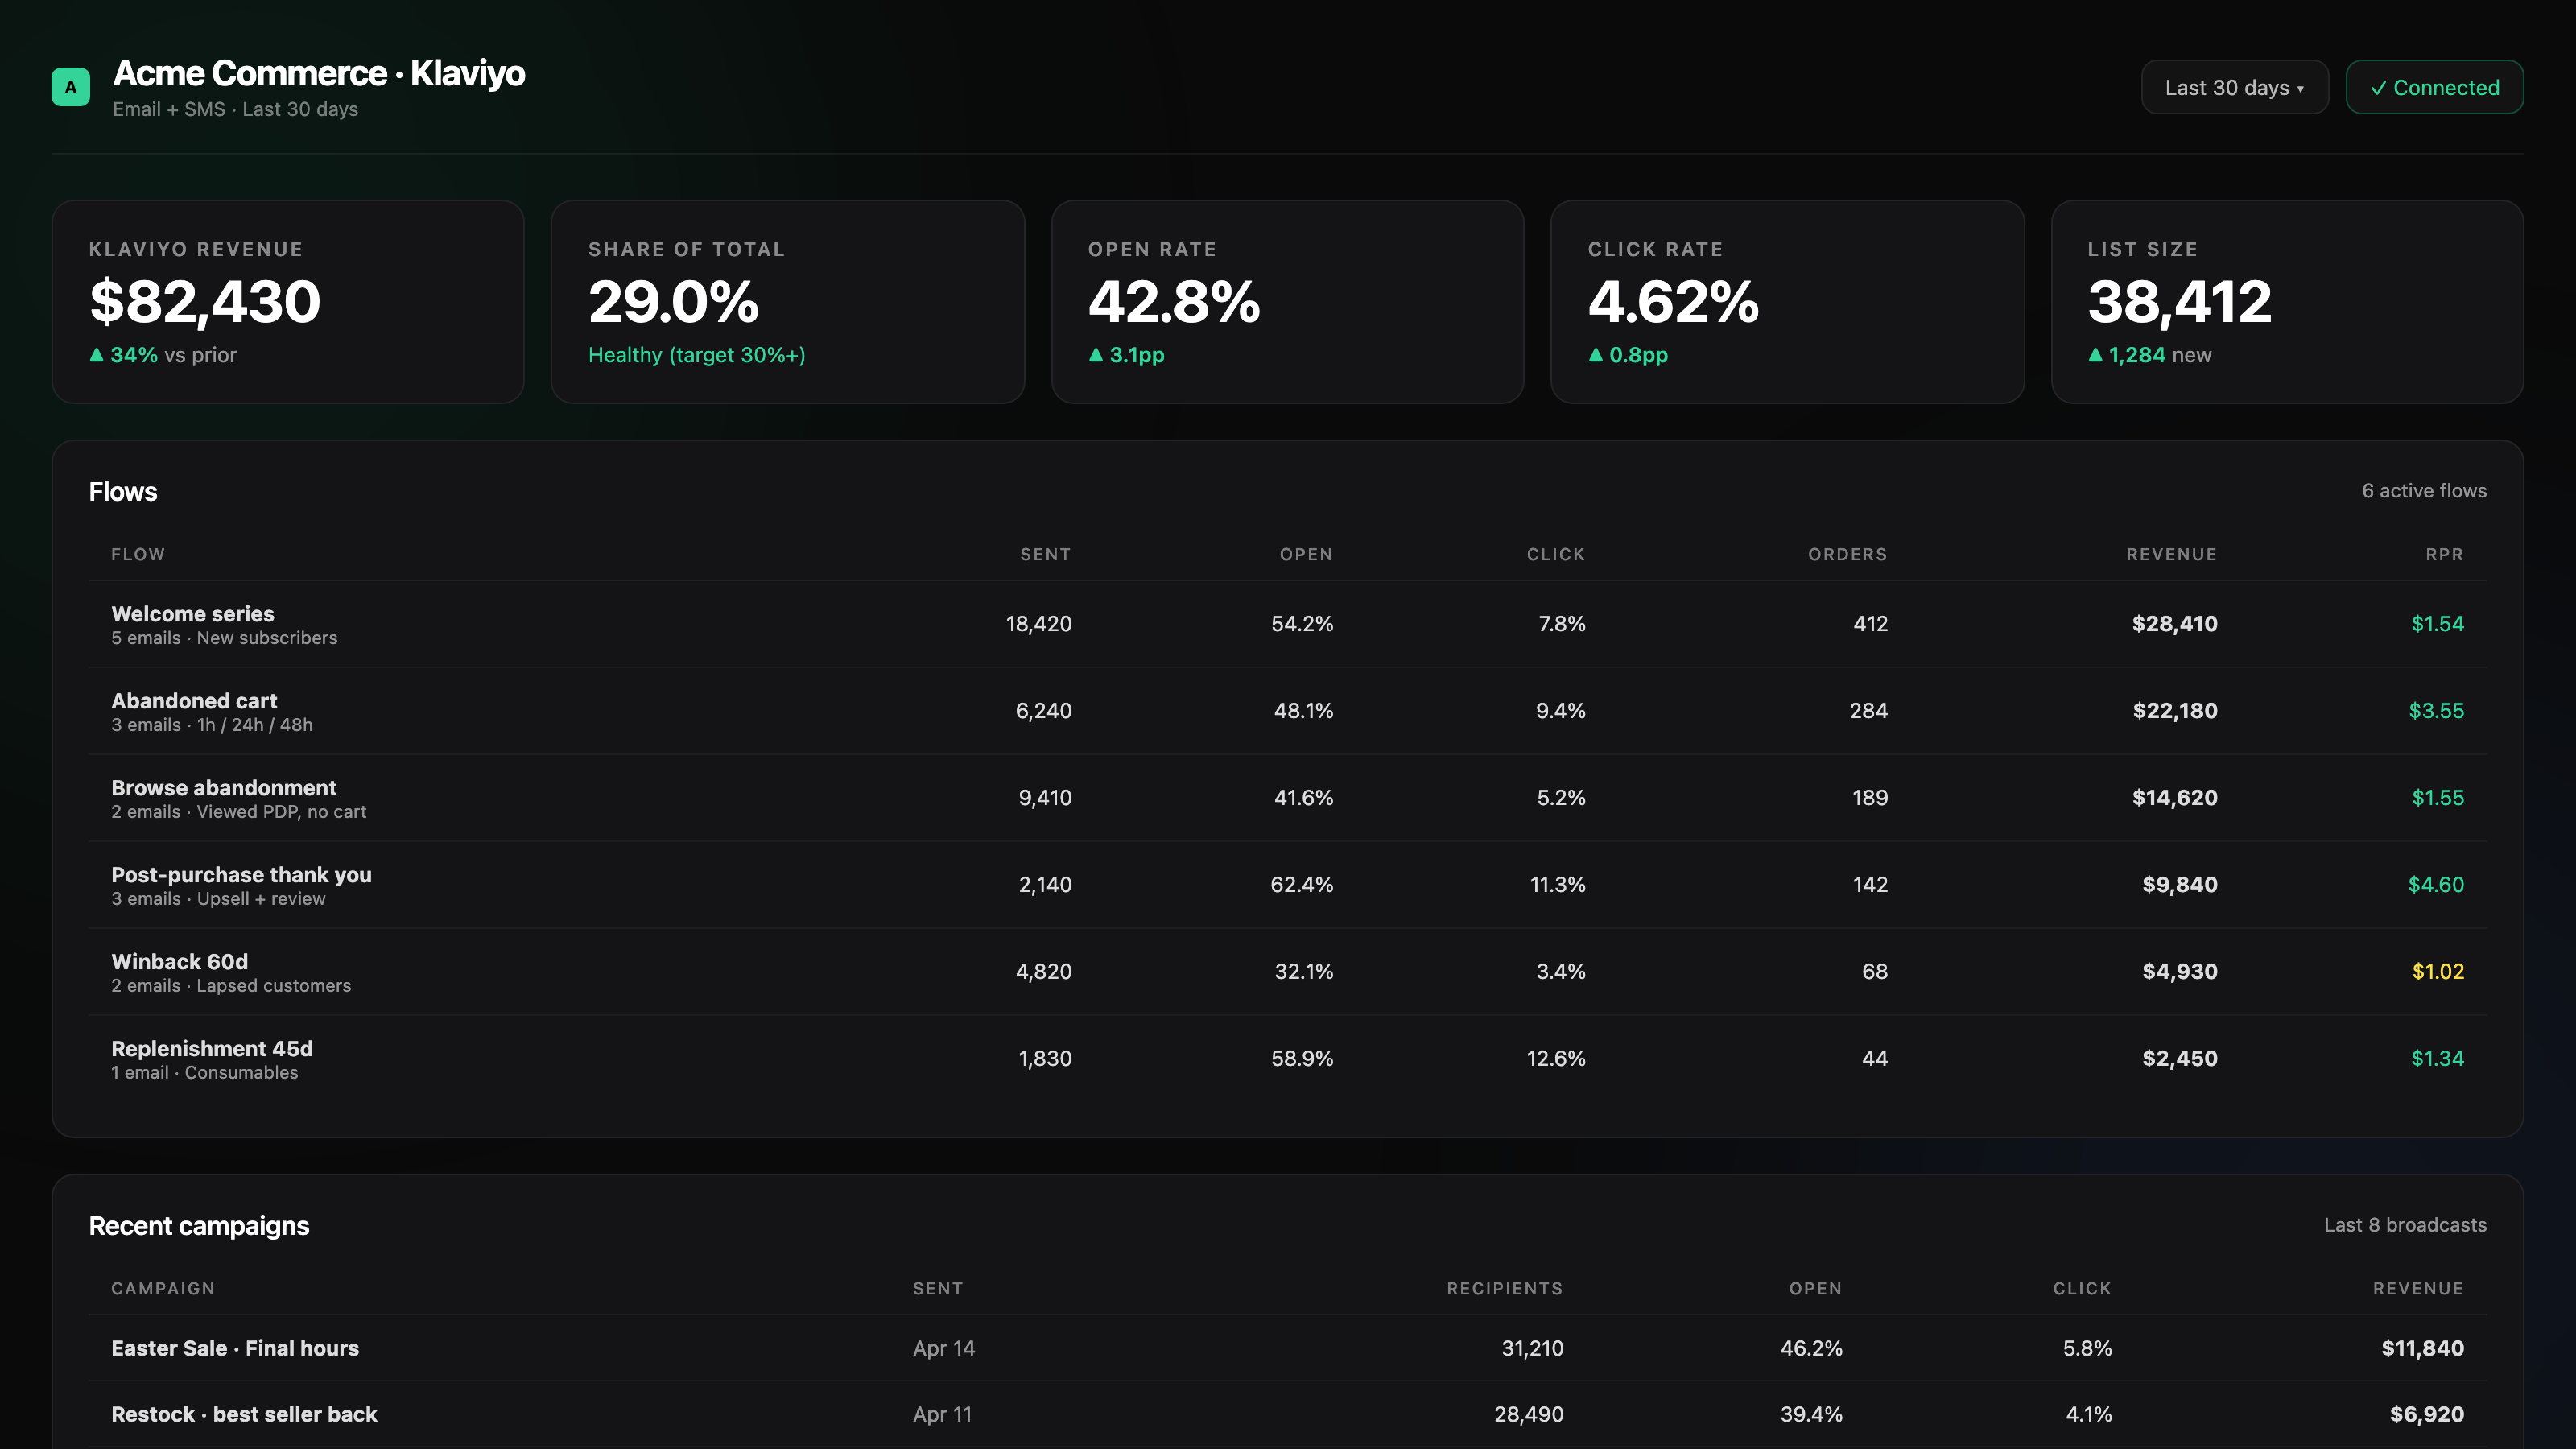
Klaviyo flows, campaigns, and segment revenue connected to your Shopify orders. See which flows drive repeat purchases, which campaigns bomb, and which segments are leaking LTV.
04
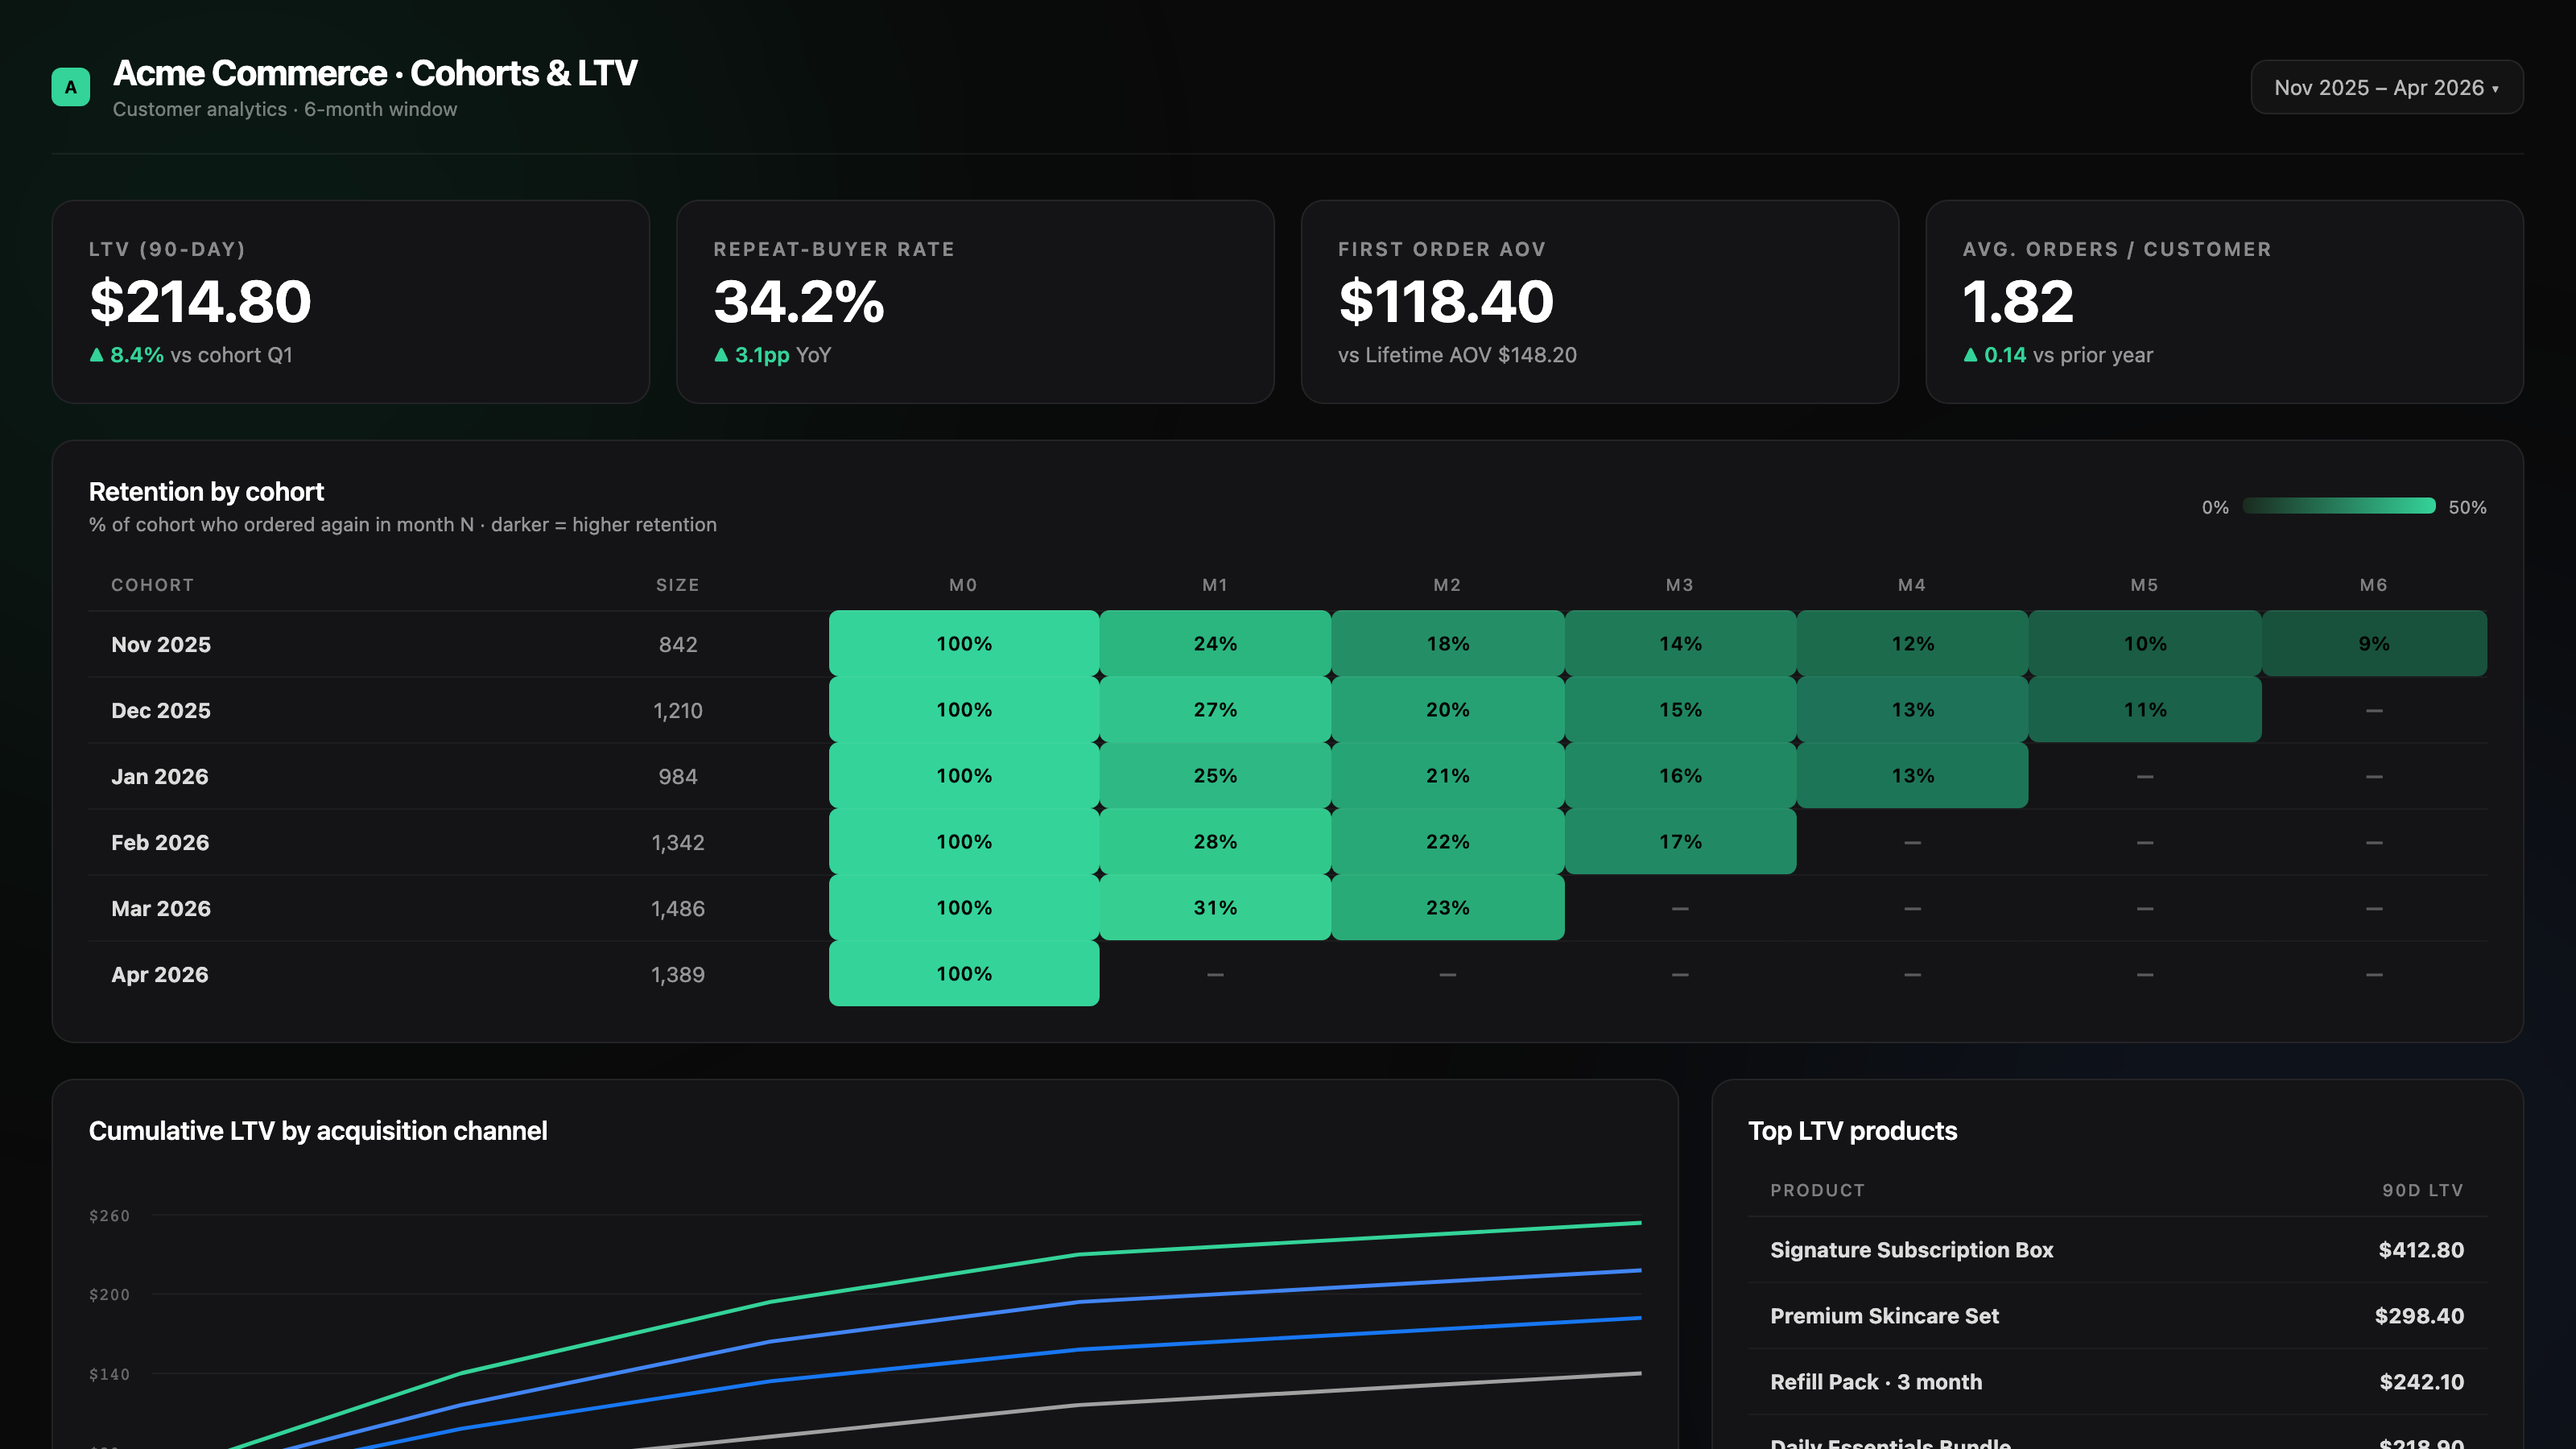
Which acquisition cohorts are profitable 30/60/90 days out. Retention curves by product, by campaign, by channel. Repeat-buyer rate. First-order AOV vs lifetime AOV.
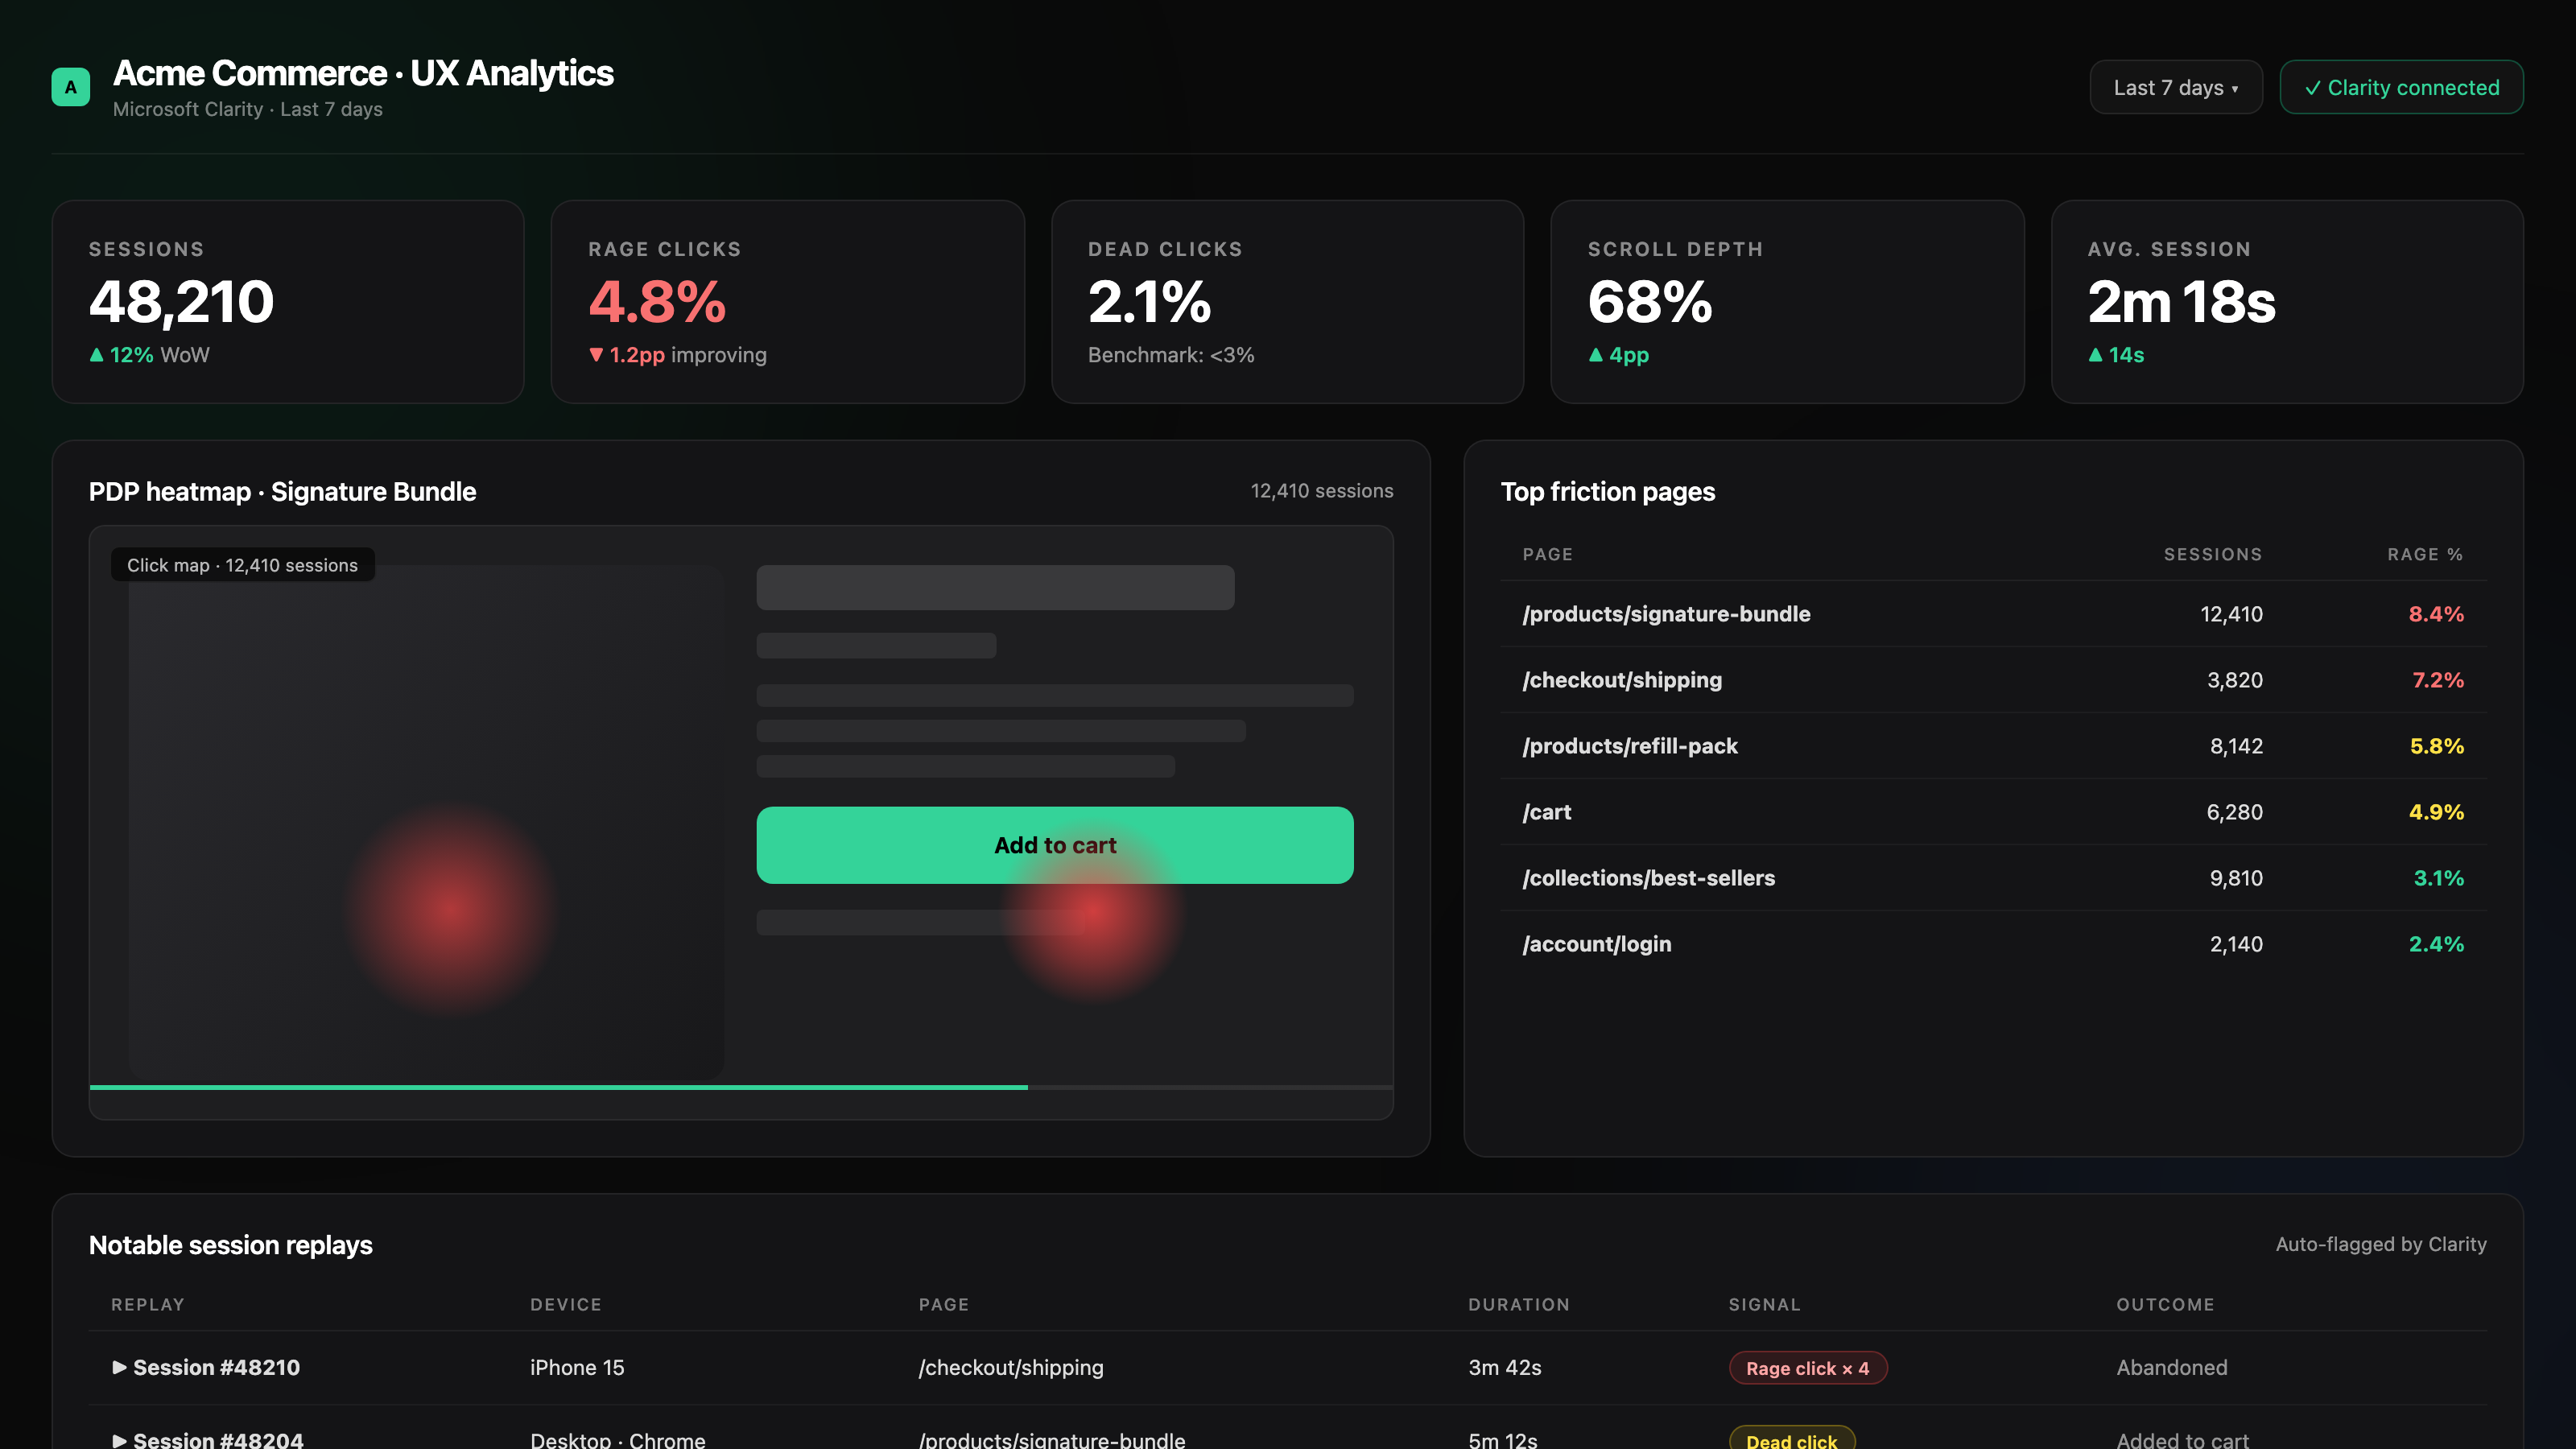
05
Rage clicks, scroll depth, session replays. Find the friction on your PDPs and checkout. Built in, not a separate tool to log into.
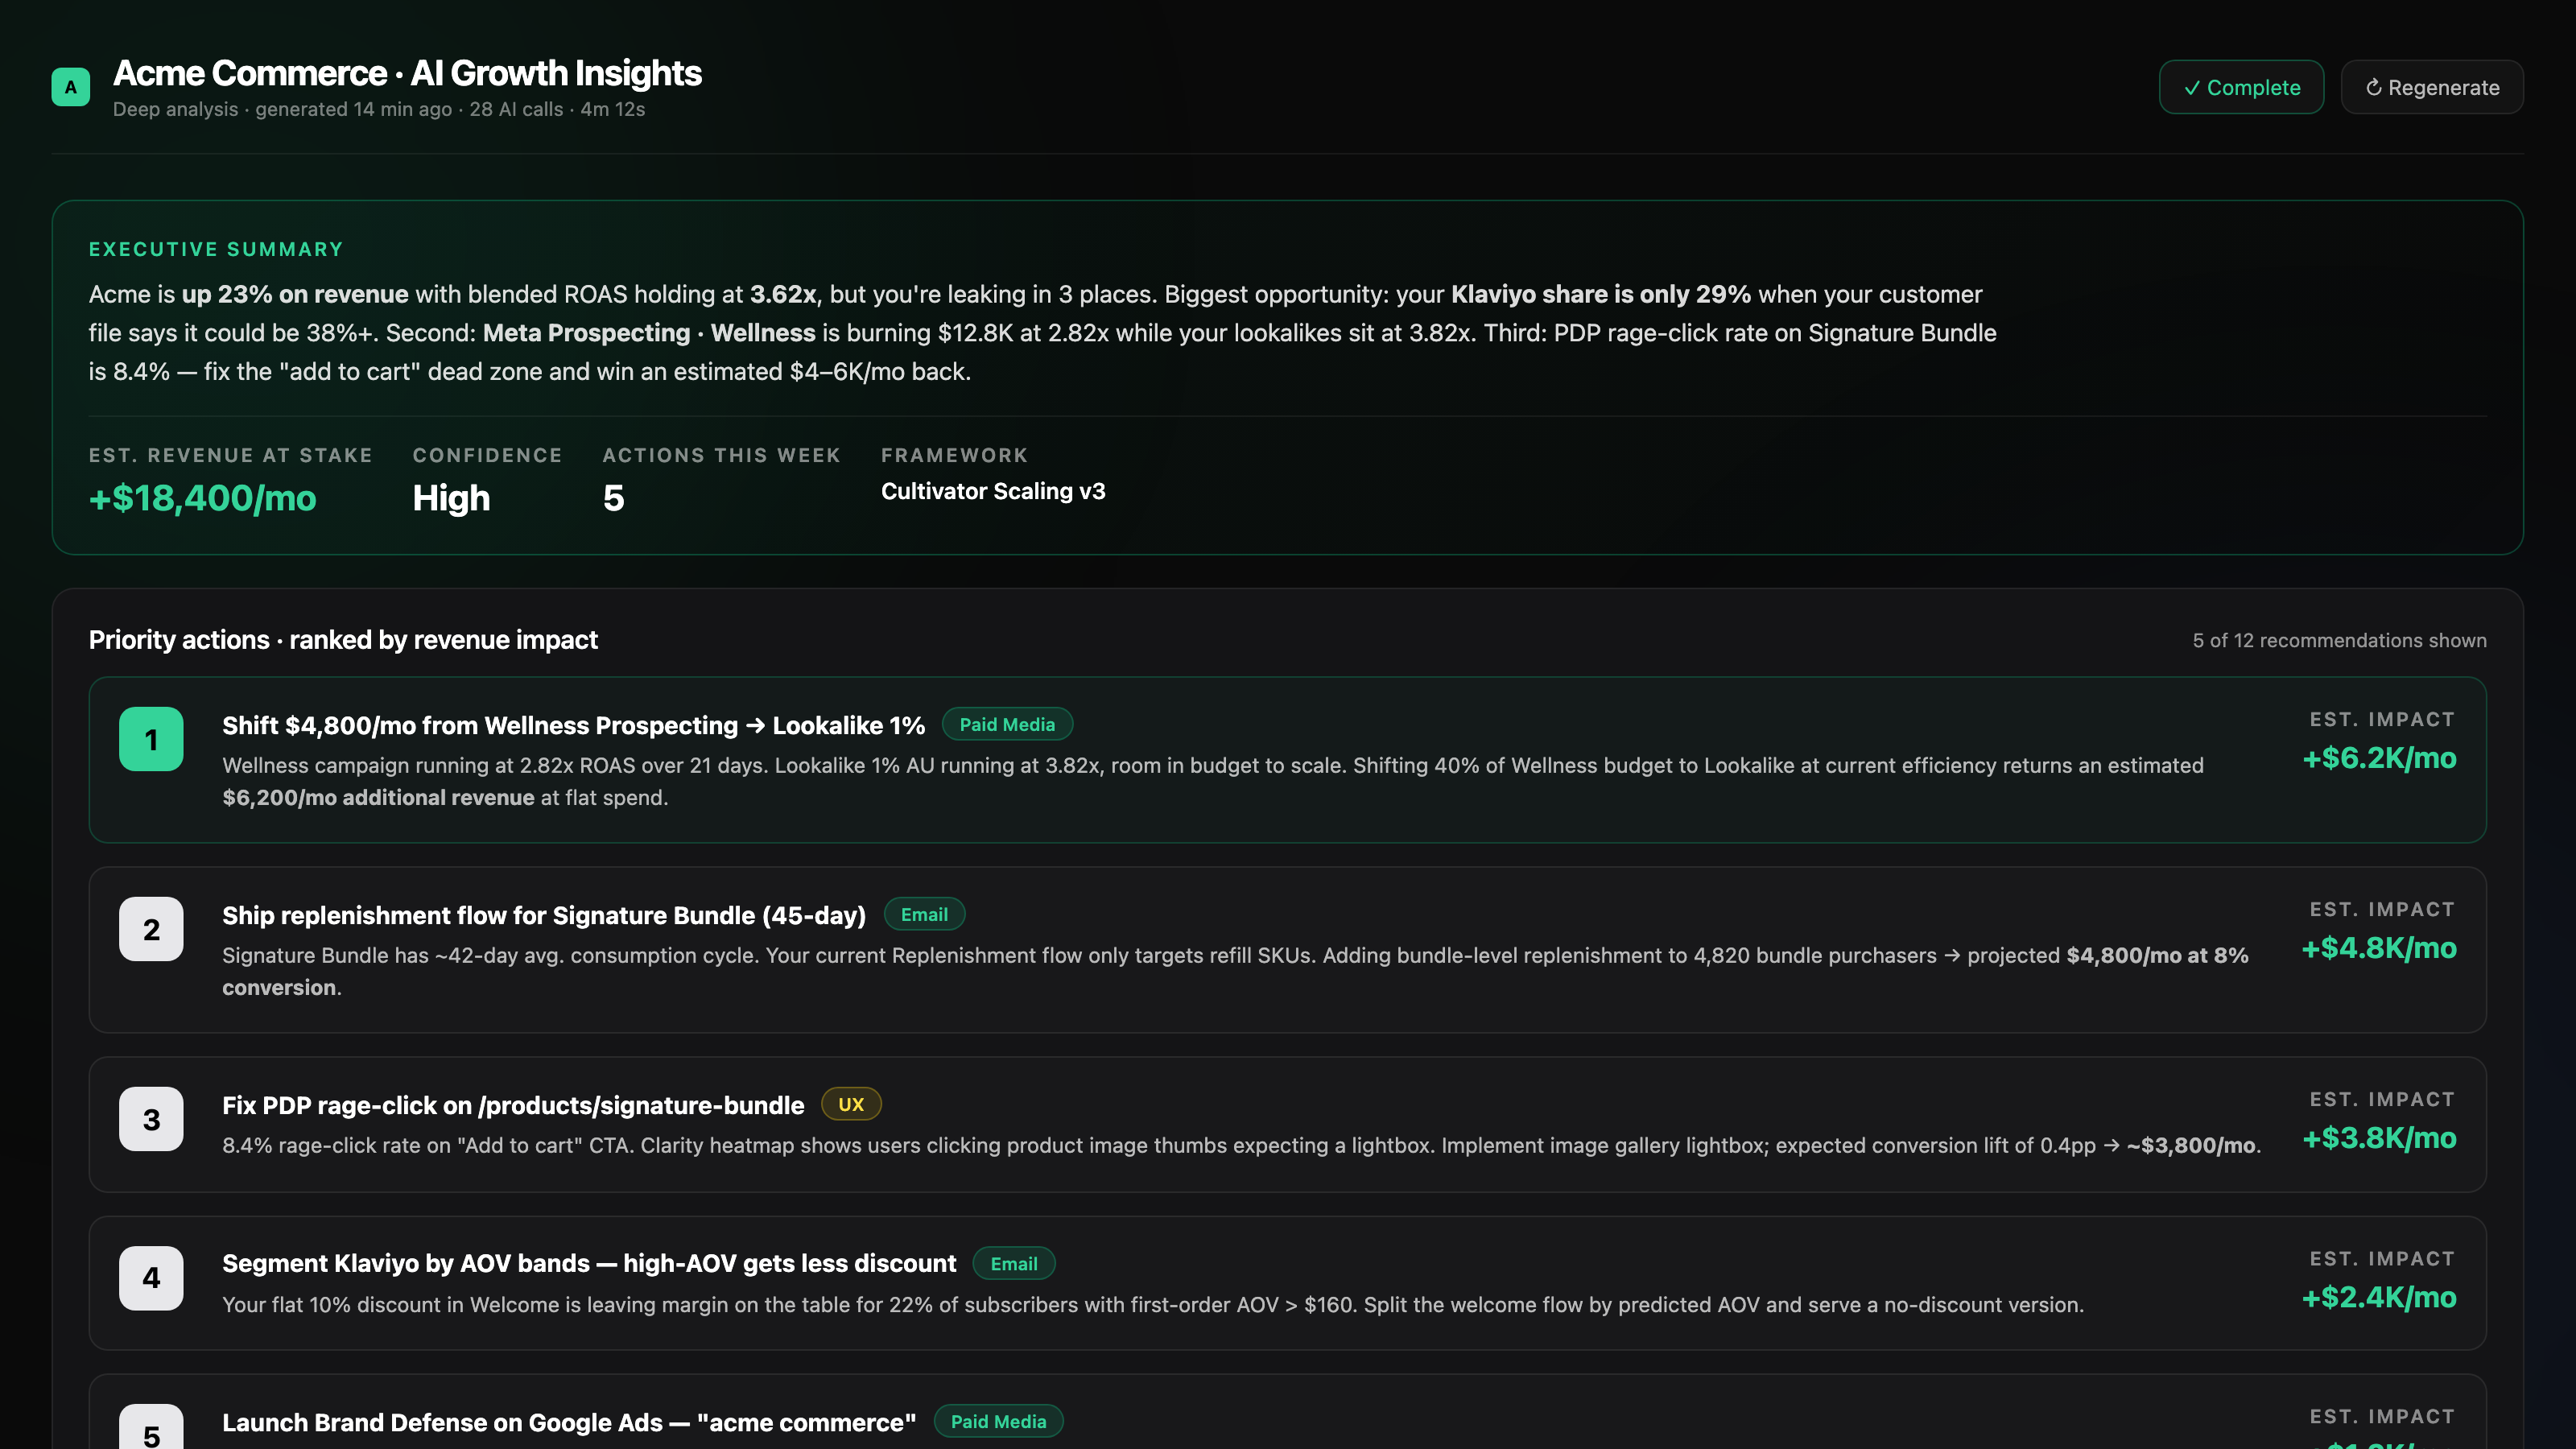
06
A deep analysis agent reviews your numbers on demand (or on a weekly schedule). Pulls from Shopify, Meta, Google, Klaviyo, and Clarity. Runs 21–35 AI calls per analysis, multi-stage, to find where you’re leaking revenue.
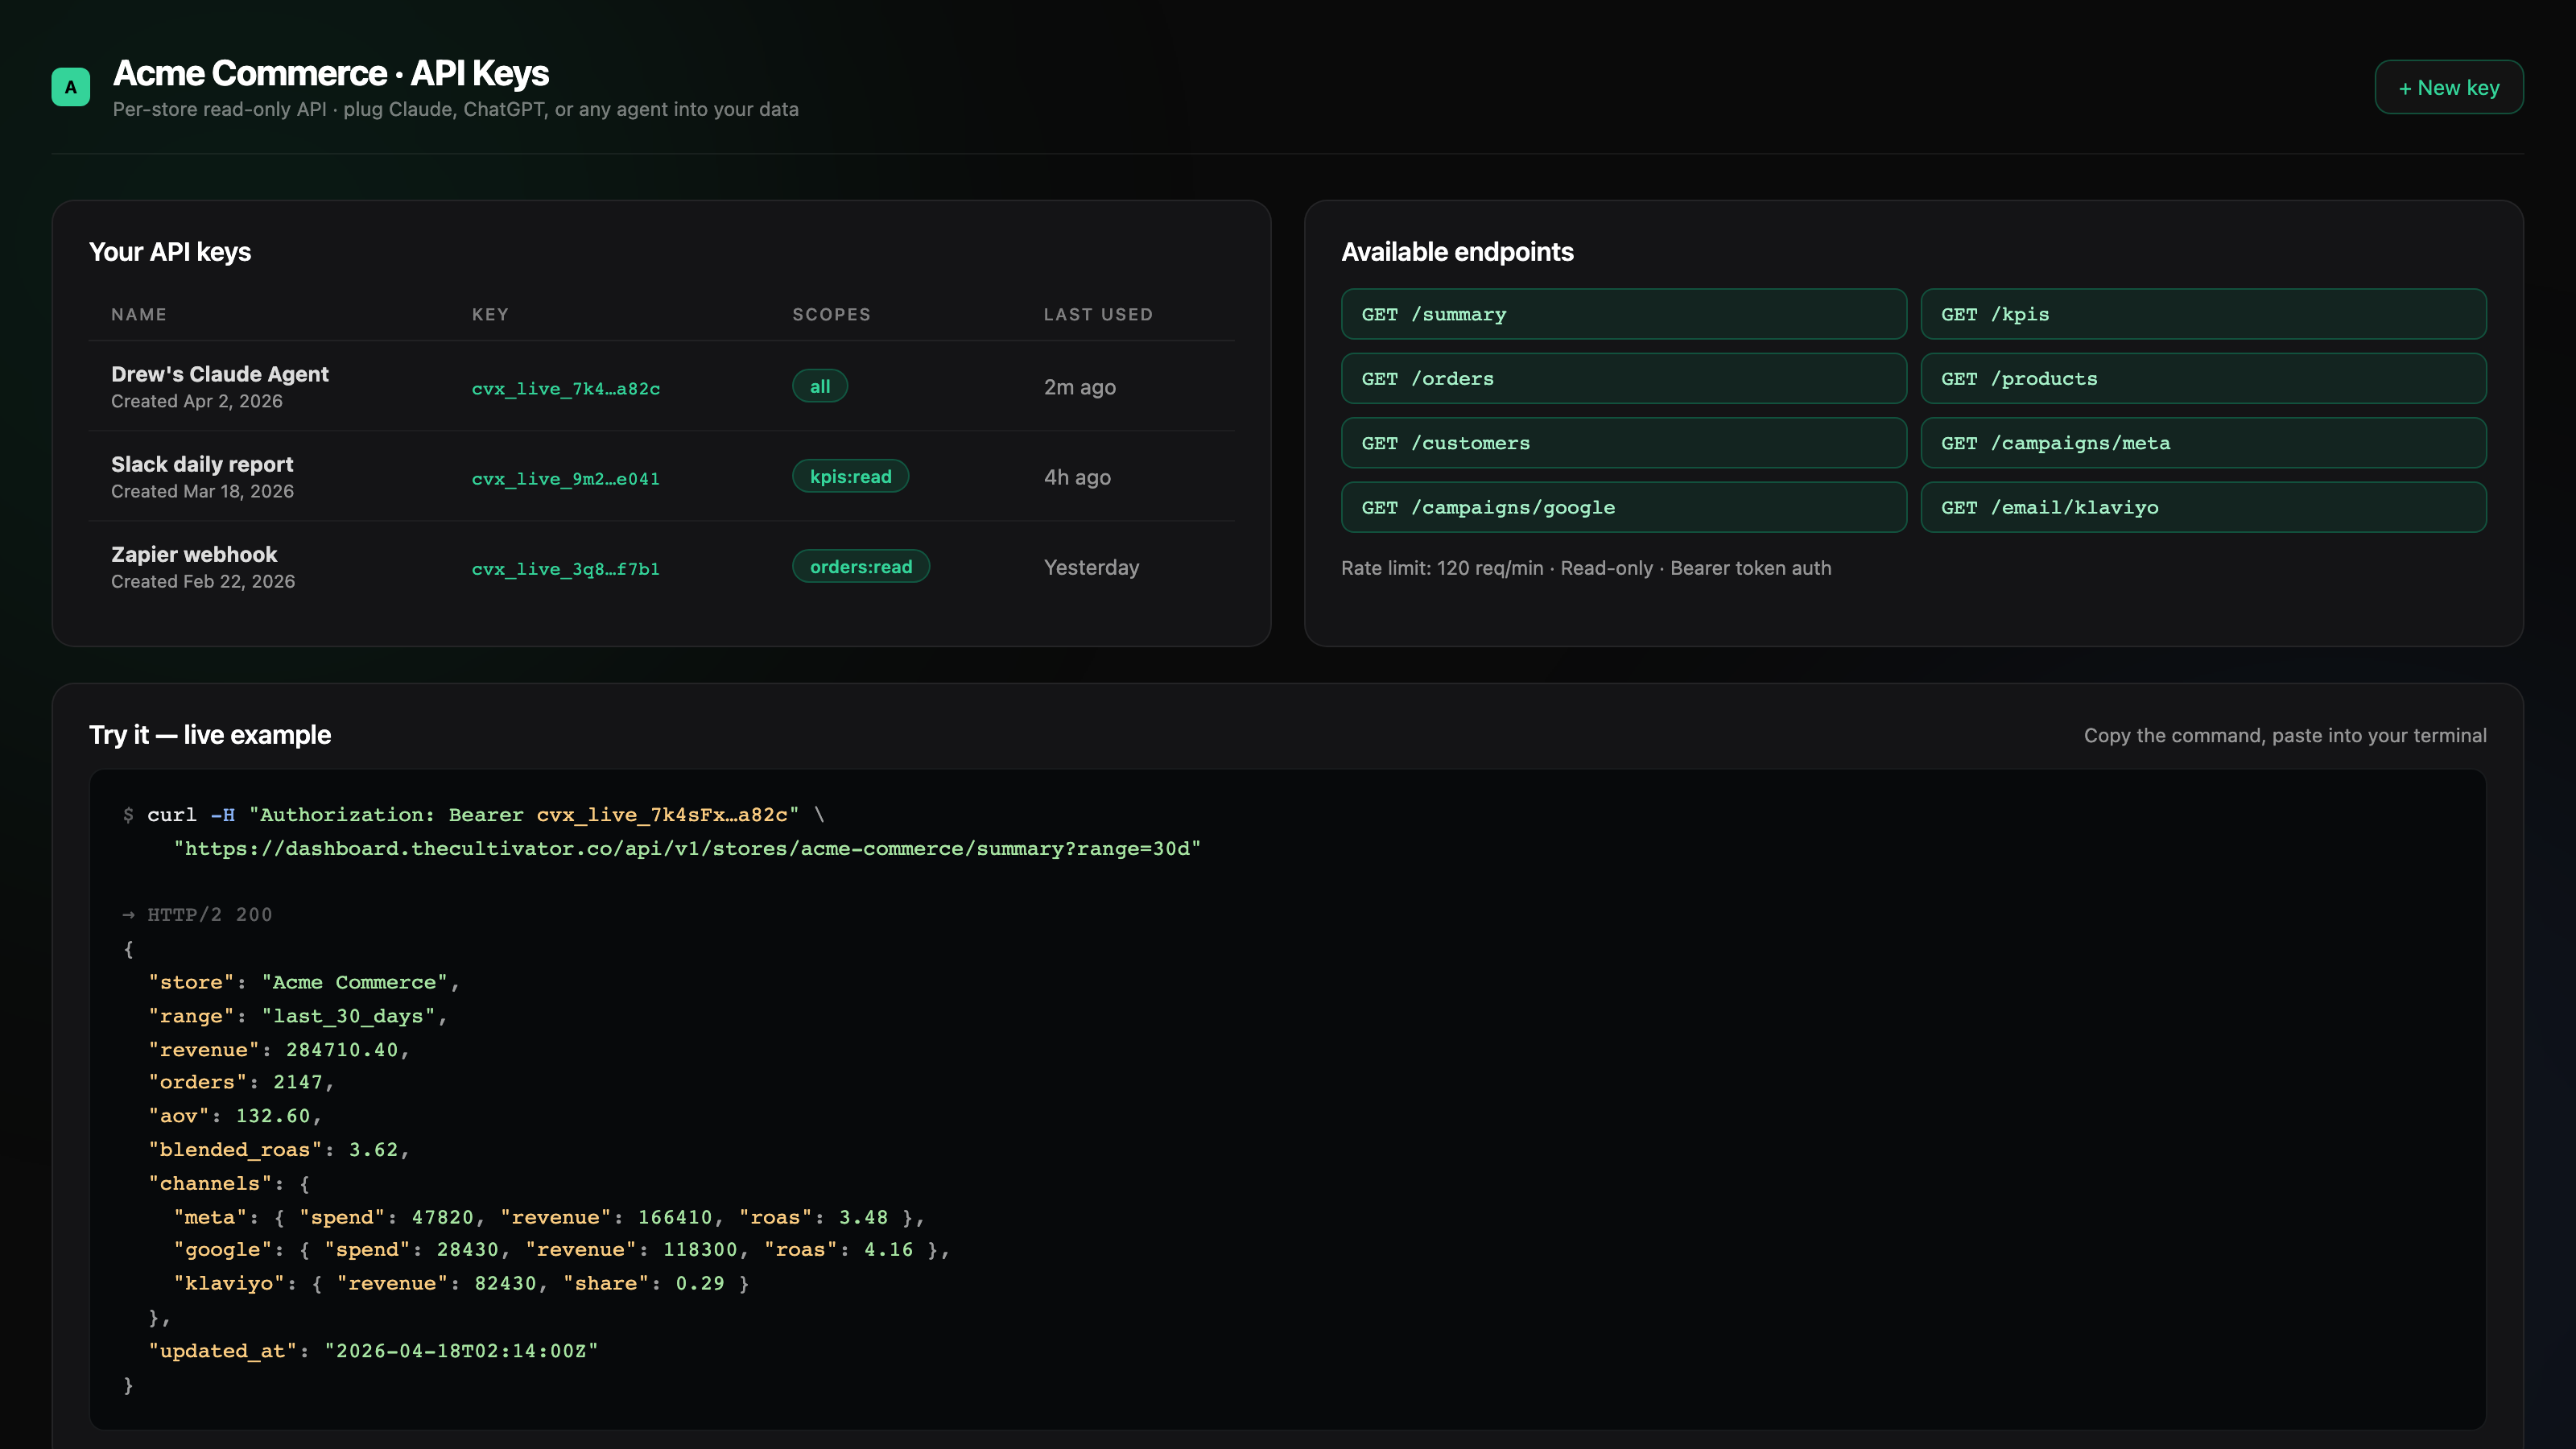
07
Every dashboard account comes with a read-only API. Plug Claude, ChatGPT, or any custom agent into your store’s data.
Endpoints
/summary/kpis/orders/products/customers/campaigns/meta/campaigns/google/email/klaviyoExample
curl -H "Authorization: Bearer cvx_live_..." \
  https://dashboard.thecultivator.co/api/v1/stores/YOUR_SLUG/summary
Use cases
Daily revenue snapshots in your Slack. A Claude agent that answers “how did we do yesterday”. An automation that flags drops in real time. Any custom workflow you can imagine.
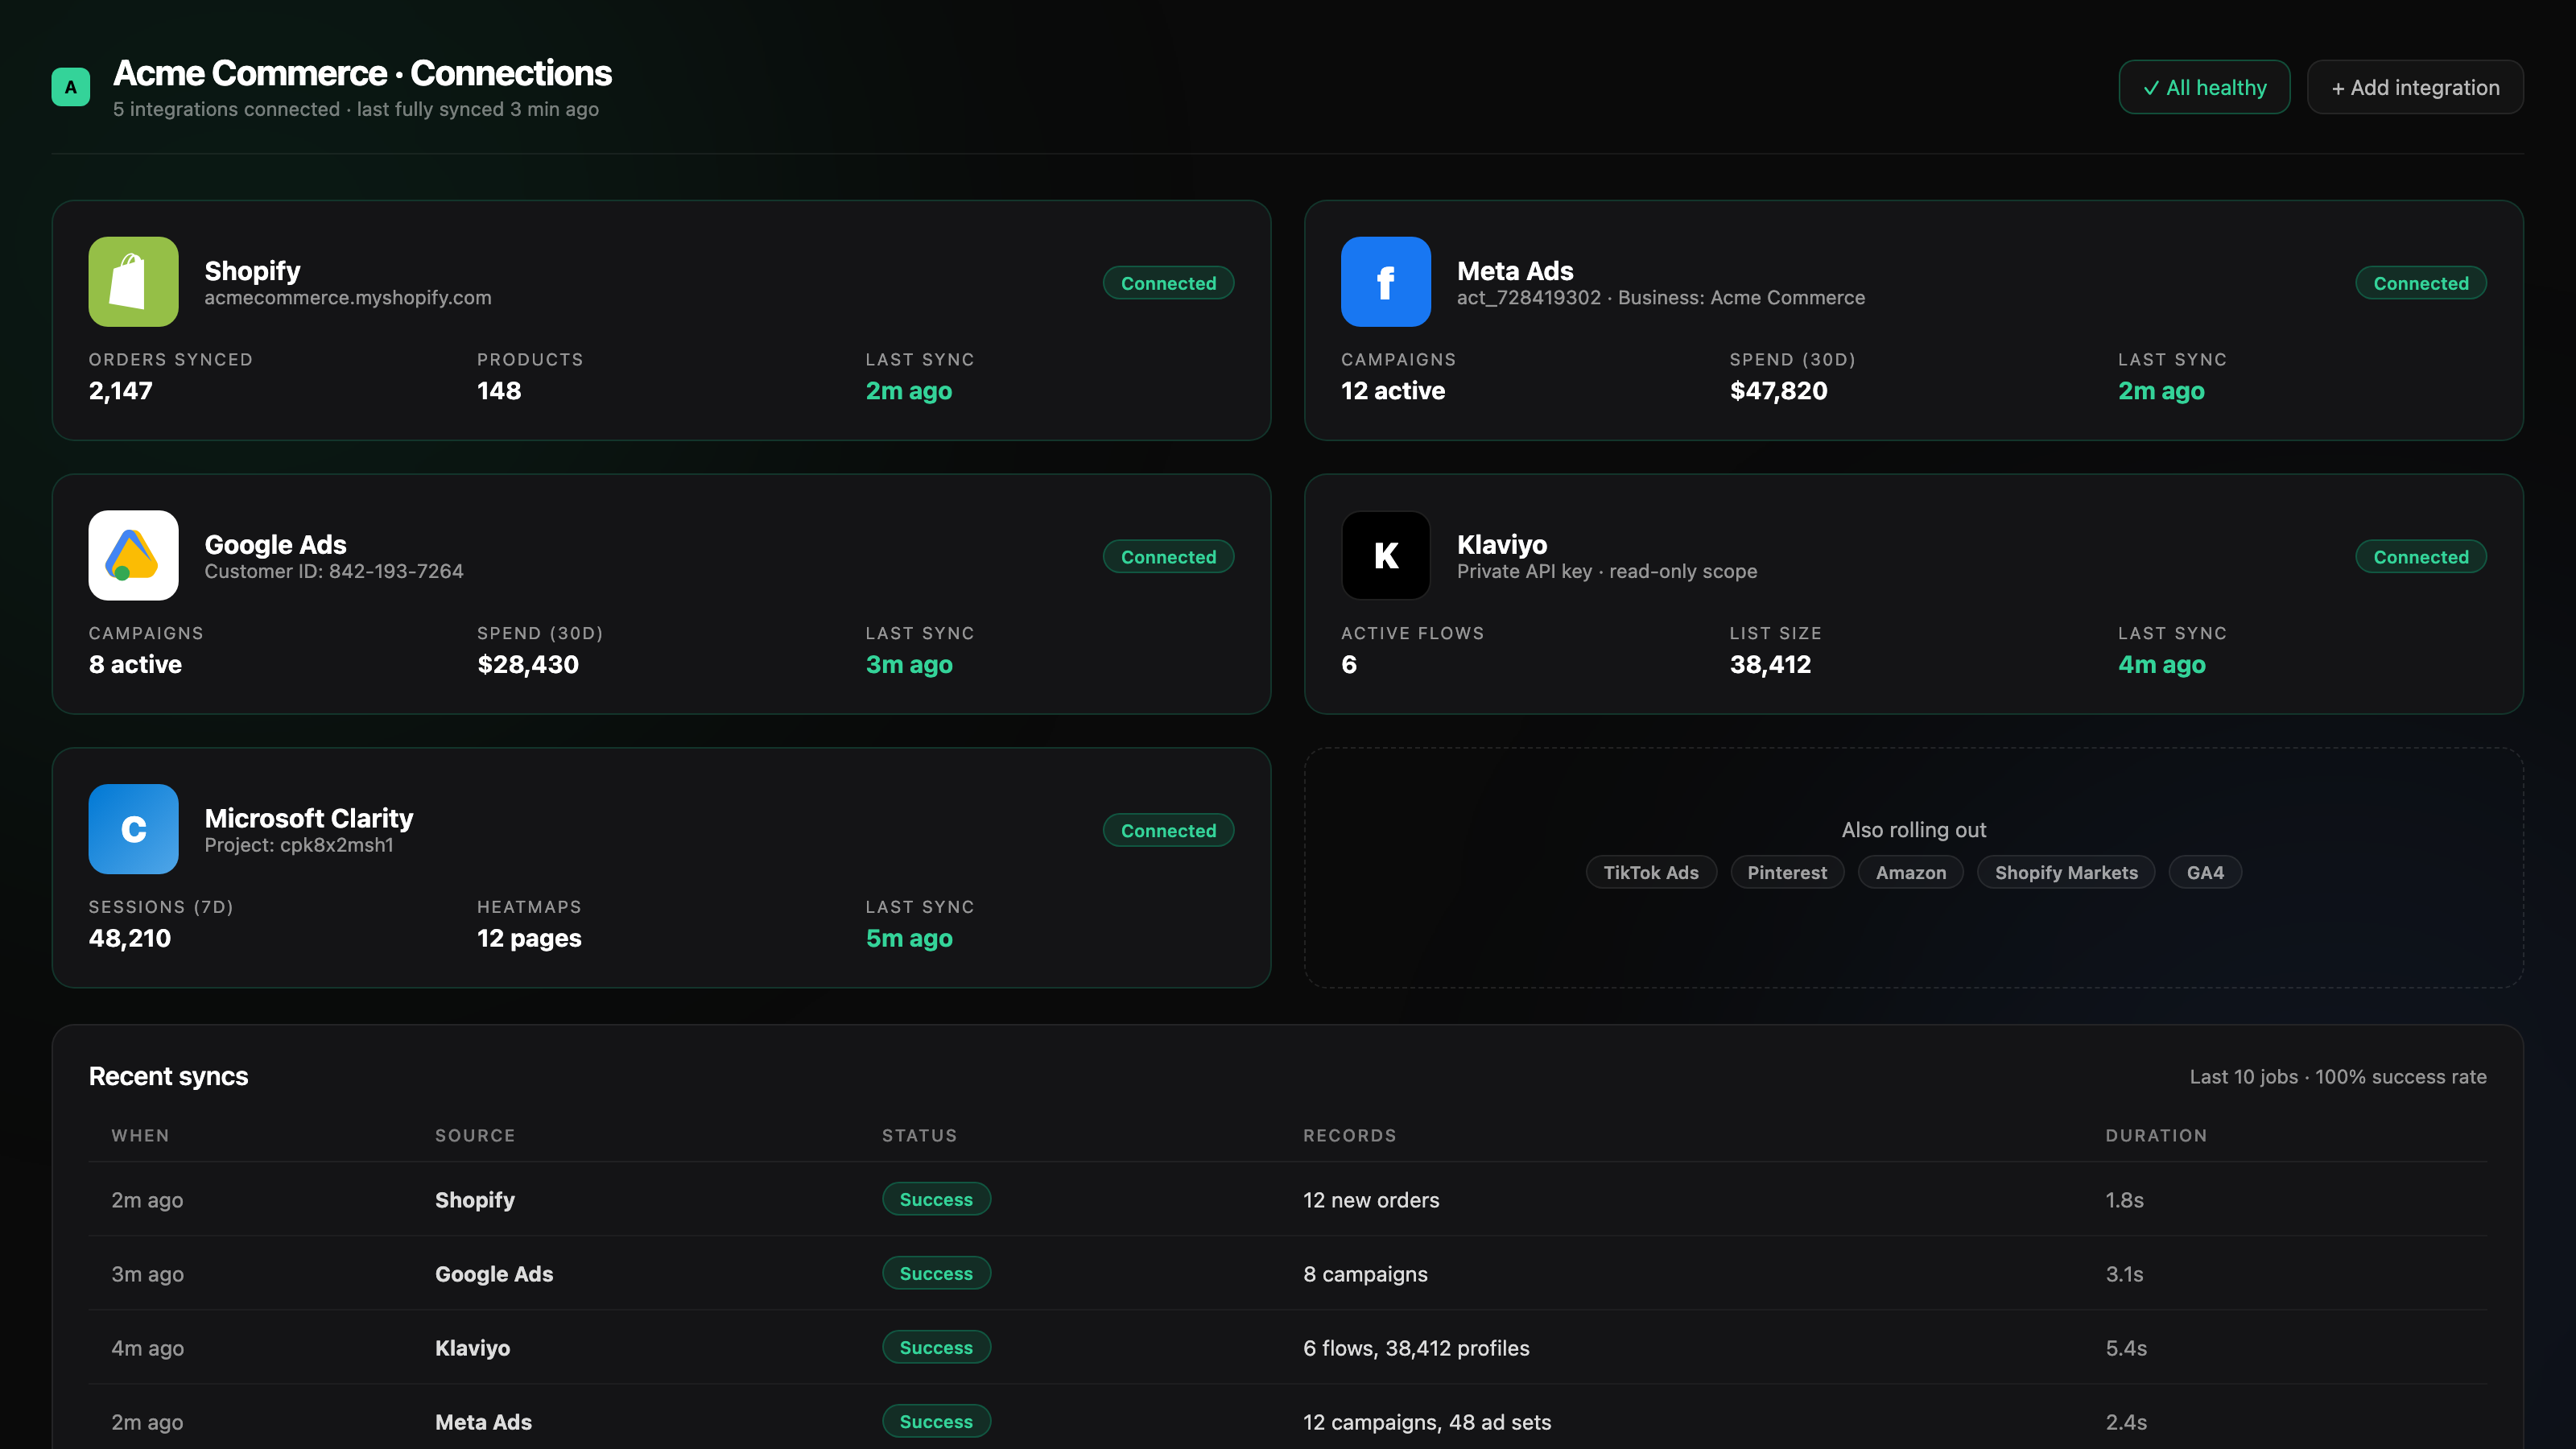
08
Everything your store runs on, pulled into one view.
Shopify
Orders, products, customers, inventory
Meta Ads
Campaign performance, spend, ROAS, audiences
Google Ads
Campaigns, keywords, conversion tracking
Klaviyo
Flows, campaigns, segments, revenue attribution
Microsoft Clarity
Session replay, heat maps, rage clicks
More integrations rolling out — TikTok Ads, Pinterest, Amazon, Shopify Markets.
09
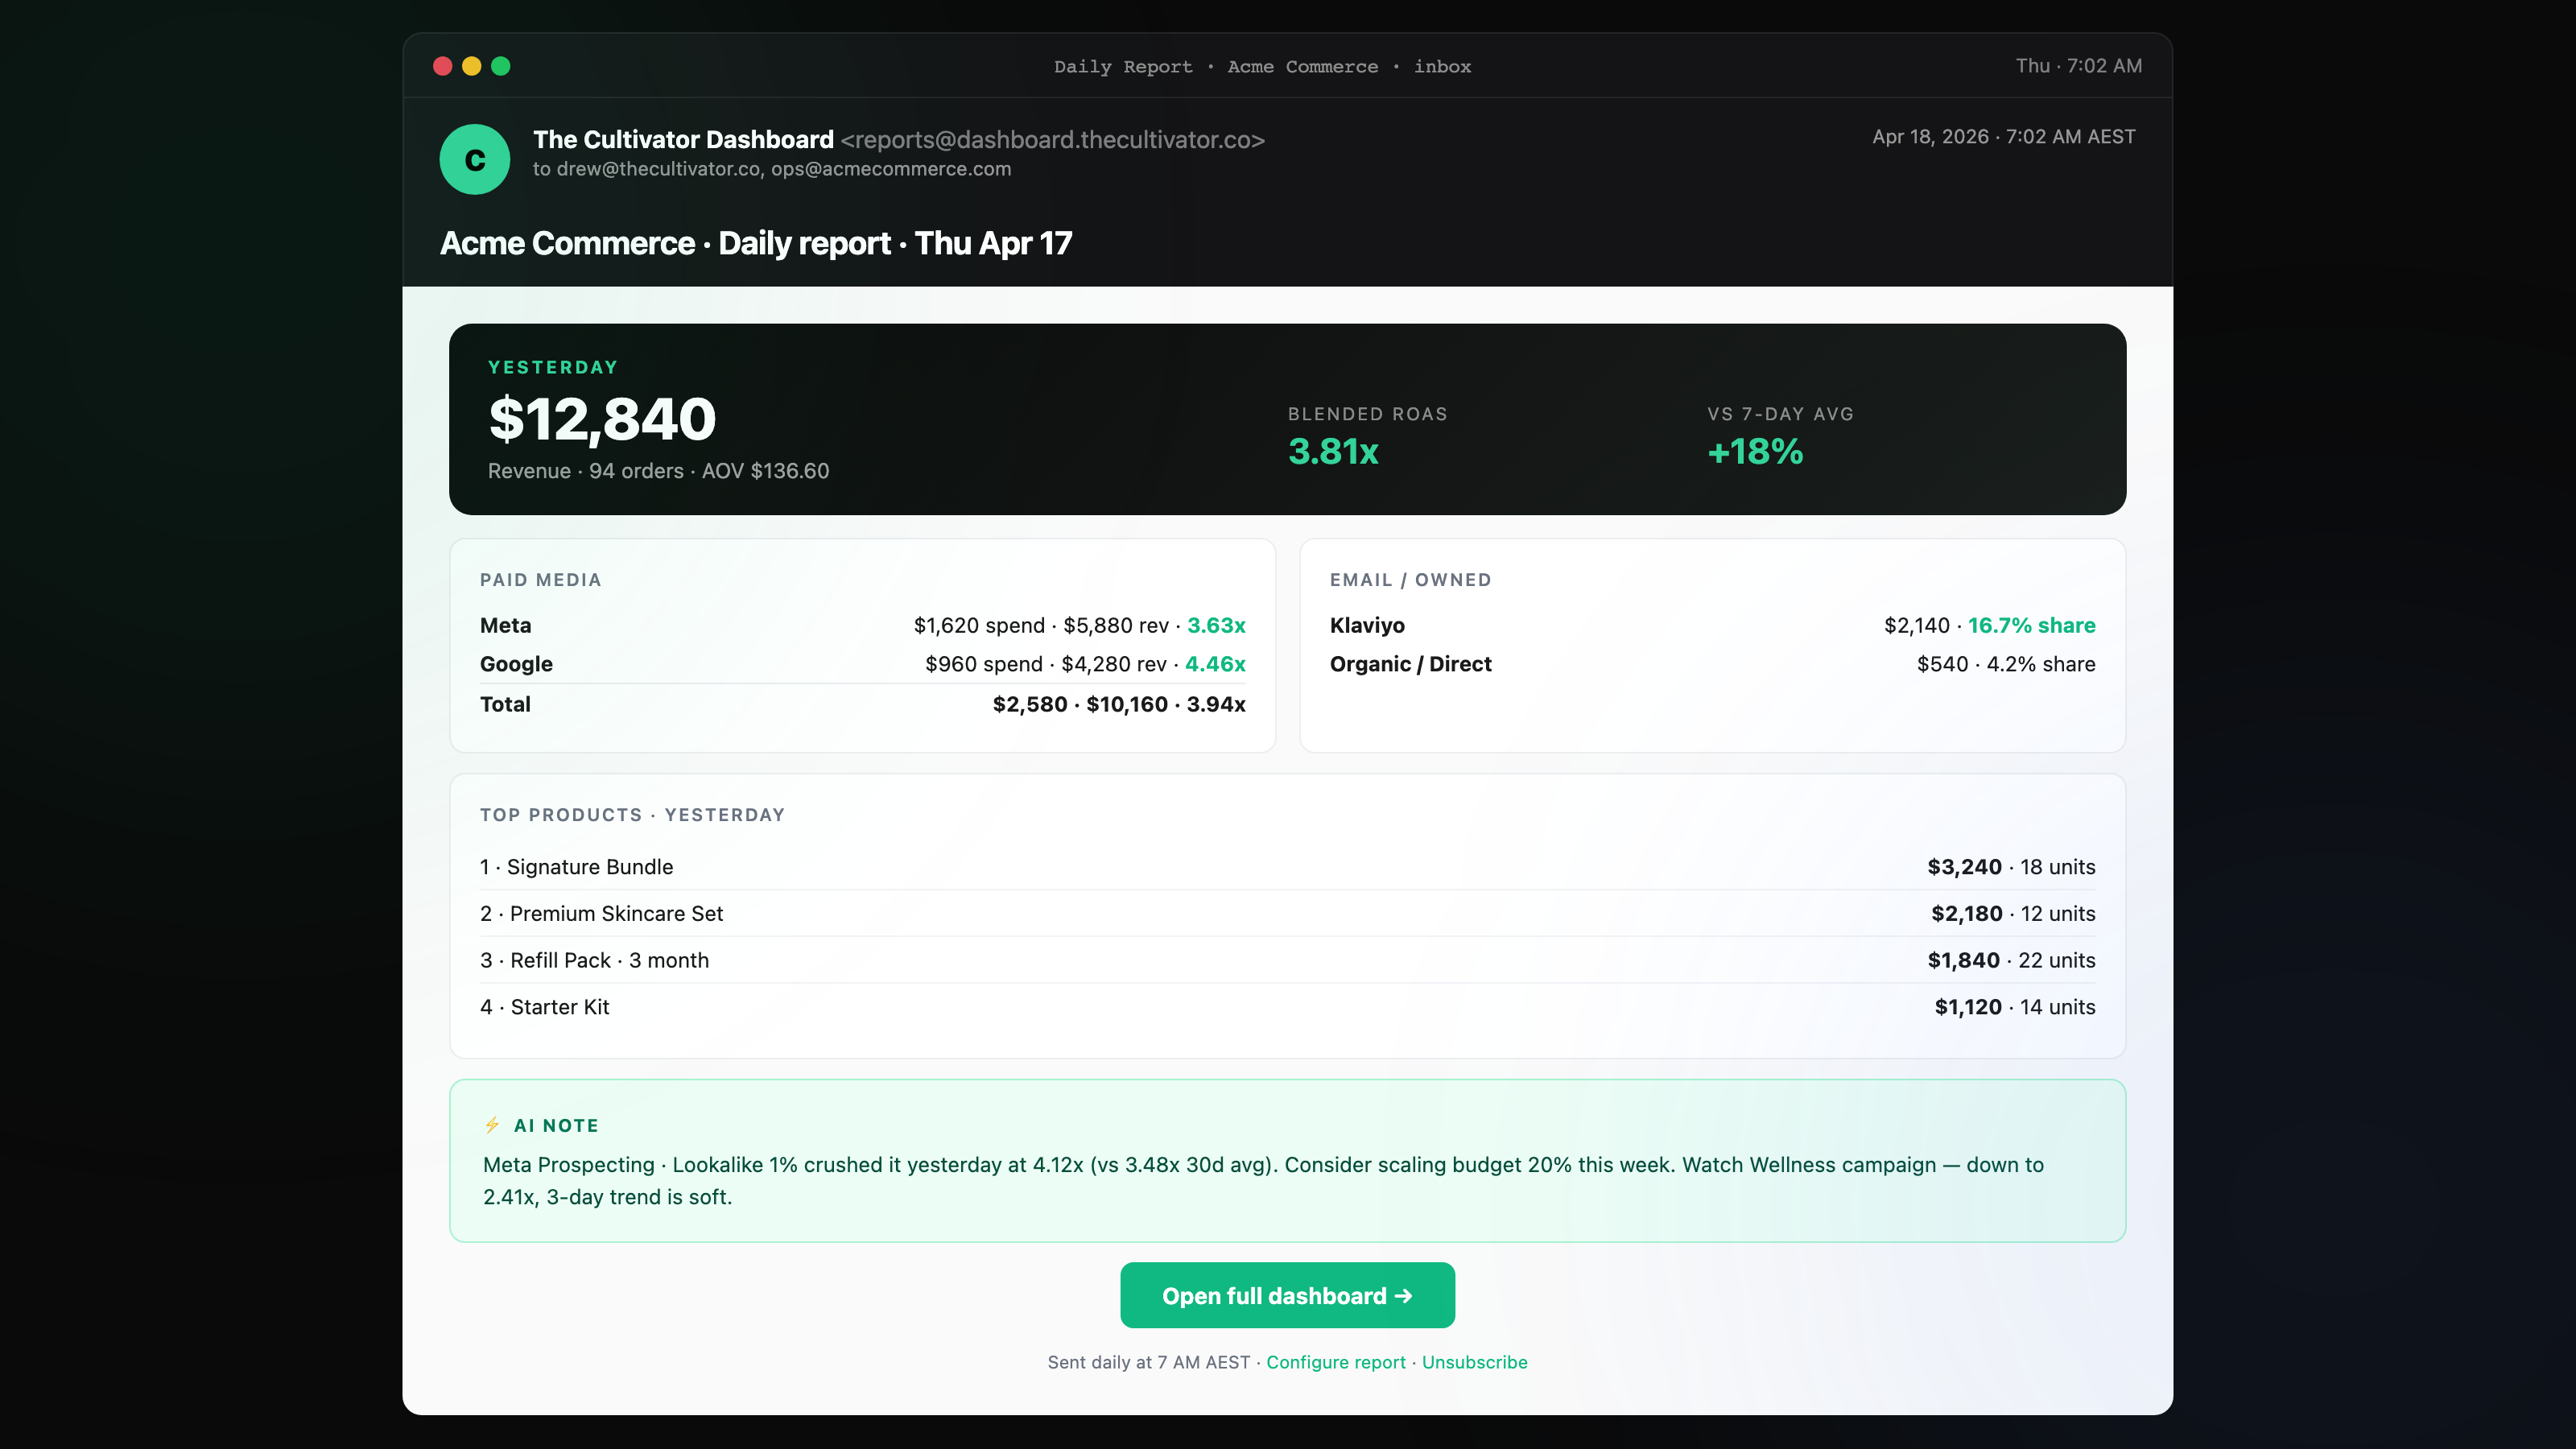
One-click summaries emailed to you or your team. Revenue, ROAS, conversion, top products — no dashboard clicking required. Configure what goes in each report per store.
Used by brands scaling fast
Sam
22x’d to $80K/mo
Joel
22x’d to $41K/mo
Sophie
30x’d sales, $1K → $30K in 60 days
Jack
$5K/mo → $30K/mo
100+ brands scaled. $20M+ generated.
Takes 2 minutes to create an account. Always free.
Already have an account? Sign in →